
Growth Guarantee Scheme (including Recovery Loan Scheme iteration 3) performance data as at 30 September 2026
On 1 August 2022, applications opened for the government-announced third iteration of the Recovery Loan Scheme (RLS 3). The British Business Bank launch supported the ongoing commitment to empower UK smaller businesses to invest and grow through sustainable, accessible funding.
Originally due to end on 30 June 2024, it was announced in the 2024 Spring Budget that the scheme would be extended for a further two years until 31 March 2026. To reflect the successful evolution of the scheme, it was renamed the Growth Guarantee Scheme (GGS), and launched on 1 July 2024. Data for this new phase is combined with historical data for RLS 3.
In April 2025, the Chancellor announced that GGS will provide approximately £500m of additional lending capacity aimed at smaller businesses that may need support with cashflow issues due to changes in global tariff rates. In the 2025 Spending Review, GGS was extended until 31 March 2030.
GGS is a government-backed loan scheme designed to support access to finance and growth for UK businesses with turnover of up to £54m. The Government provides a 70% guarantee to the lender of the outstanding scheme facility amount. The borrower remains 100% liable for the debt. Further details on the Growth Guarantee Scheme are available on the British Business Bank website.
GGS is supported by a diverse group of more than 70 lenders, to date delivering £4.30bn in financing to UK smaller businesses, with £2.96bn of that funding reaching businesses outside of London and the South-East.
The first two iterations of the Recovery Loan Scheme enabled £4.33bn of finance. Data for RLS iteration 1 & 2 is published separately. Further details on the Recovery Loan Scheme are available on the British Business Bank website.
Performance Data
The British Business Bank will continue to publish GGS performance data on a quarterly basis. The performance data for this publication is as at 30 September 2026. It should be noted that the data is reliant on information submitted to the British Business Bank’s scheme portal by accredited lenders.
GGS has been utilised to enable 24,771 scheme facilities, totalling £4.30bn and driving the sustainability and growth of the associated smaller UK businesses. To date, 1,750 lender claims of £103.30m have been settled by the British Business Bank against the Government guarantee. This equates to 2.40% of the total drawn value or 7.06% of the total number of drawn facilities.
Detailed facility status
See Definitions below when interpreting these tables.
Summary Facility Status
| Furthest life event reached | Number of facilities | % Number of facilities | Outstanding balance (£m) | Final value (£m) |
|---|---|---|---|---|
| On Schedule | 18,500 | 74.68% | 2,588.98 | - |
| Arrears | 686 | 2.77% | 73.04 | - |
| Defaulted | 403 | 1.63% | 59.86 | - |
| Claimed | 253 | 1.02% | 12.49 | - |
| Settled | 1,750 | 7.06% | - | 103.30 |
| Fully Repaid | 3,179 | 12.83% | - | 515.18 |
| Grand Total | 24,771 | 100.00% | 2,734.37 | 618.48 |
Note on on Summary Facility Status table
The aggregate total of Outstanding Balances and Final Values do not sum up to the total Drawn Value due to changes in facility amounts outstanding over time, e.g. due to partial repayments of a facility, certain recoveries received in respect of a facility and facility amounts written-off by lenders.
The below table depicts the original drawn aggregate facility value and the number of facilities for each lender, together with the current aggregate value and number of settled facilities for each lender. This is followed by tables and a visual, which breaks down GGS facilities by the following categories: region, SIC group, facility type, company size, facility size, turnover, and age of business.
Breakdown of facilities drawn and settled
| Lender name | Drawn value (£m) | Number of facilities | Settled value (£m) | Settled number of facilities |
|---|---|---|---|---|
| ABN AMRO Asset Based Finance N.V. | 6.97 | 10 | 0.41 | 1 |
| Aldermore Bank Plc | 12.15 | 27 | 0.36 | 1 |
| Allica Bank Limited | 313.55 | 1,061 | 0.99 | 11 |
| Arbuthnot Latham & Co Ltd | 99.62 | 95 | - | - |
| Arkle Finance Ltd | 58.24 | 665 | 0.45 | 11 |
| ART SHARE Limited | 9.81 | 148 | 0.31 | 9 |
| Atom Bank plc | 239.25 | 393 | - | - |
| Bank of Scotland plc | 13.07 | 33 | - | - |
| Barclays Bank Plc | 244.27 | 530 | - | - |
| BCRS Business Loans Ltd | 21.26 | 257 | 0.31 | 5 |
| Big Issue Invest Ltd | 6.19 | 71 | 0.01 | 1 |
| Business Enterprise Fund | 41.67 | 540 | 1.58 | 36 |
| Business Finance Cumbria (formerly Enterprise Answers) | 4.83 | 62 | - | - |
| Business Lending Group | 23.28 | 47 | 0.68 | 1 |
| Capitalise Business Support Ltd | 13.56 | 168 | 0.68 | 16 |
| Close Brothers Ltd | 555.37 | 2,900 | 11.25 | 143 |
| Compass Business Finance | 66.88 | 765 | 2.29 | 46 |
| Coventry & Warwickshire Reinvestment Trust Ltd | 21.69 | 184 | 1.17 | 20 |
| Creative Growth Finance | 3.30 | 10 | - | - |
| Danske Bank | 8.99 | 20 | - | - |
| DSL Business Finance | 0.42 | 9 | 0.05 | 2 |
| Enterprise Loans East Midlands | 18.17 | 171 | 1.58 | 34 |
| EVBL (General Partner NPIF Y&H Debt) Limited | 18.10 | 72 | 0.97 | 6 |
| Finance for Enterprise | 45.43 | 322 | 2.37 | 33 |
| FSE Finance East Loan Management (FE LM) | 5.76 | 23 | 0.18 | 2 |
| FSE FYI LP | 6.84 | 48 | 0.16 | 2 |
| FSE GLIF LD LP | 13.65 | 13 | 0.58 | 2 |
| FSE GLIF SD LP | 7.61 | 22 | 0.33 | 2 |
| FSE MEIF LP | 18.31 | 24 | 2.37 | 5 |
| Funding Circle | 529.60 | 6,509 | 41.61 | 894 |
| GC Business Finance | 1.23 | 5 | 0.41 | 2 |
| Genesis Asset Finance Ltd | 4.10 | 63 | 0.16 | 8 |
| Growth Finance Fund LP (WhiteRock Capital Partners LLP) | 8.40 | 13 | - | - |
| Hampshire Trust Bank Plc | 22.71 | 116 | 0.83 | 8 |
| Haydock Finance | 78.47 | 256 | 0.12 | 3 |
| HSBC UK Bank Plc | 564.70 | 1,594 | 8.48 | 85 |
| InterBay Asset Finance Limited | 20.93 | 135 | - | - |
| Investec Bank PLC | 28.98 | 124 | 0.11 | 3 |
| Kingsway Finance group | 100.98 | 754 | 1.15 | 18 |
| Lloyds Bank Plc | 163.05 | 581 | 0.84 | 3 |
| MEIF - ESEM SBL LP | 3.17 | 35 | 0.84 | 14 |
| MEIF - Maven East and South East Midlands | 2.61 | 8 | - | - |
| MEIF - Maven West Midlands | 3.00 | 5 | 0.53 | 1 |
| MEIF - WM SBL LP | 3.75 | 58 | 0.16 | 5 |
| Merchant Money Ltd (t/a Momenta Finance) | 33.23 | 186 | 0.70 | 6 |
| MSIF | 7.67 | 31 | 0.05 | 1 |
| Nationwide Building Society | 25.34 | 56 | 0.70 | 2 |
| NatWest Group plc | 149.83 | 603 | 1.63 | 21 |
| NE Growth (ERDF) General Partner Ltd | 3.00 | 14 | 0.63 | 5 |
| Newable Business Loans Ltd | 1.93 | 11 | 0.31 | 3 |
| North East (ERDF) Small Loan Fund Limited | 1.03 | 14 | 0.07 | 1 |
| North West Loans NPIF GP Limited | 18.19 | 55 | 1.27 | 6 |
| Novuna | 7.55 | 20 | - | - |
| NPIF - NW MF LP | 2.39 | 42 | 0.22 | 10 |
| NPIF - YHTV MF LP | 2.70 | 44 | 0.32 | 8 |
| Paragon Bank PLC | 103.36 | 839 | 1.65 | 22 |
| Propel Finance | 0.18 | 2 | - | - |
| Resonance Enterprise Investment CIC | 0.85 | 8 | - | - |
| Robert Owen Community Bank Fund | 1.08 | 23 | - | - |
| Santander UK | 51.94 | 83 | - | - |
| Shire Leasing plc | 96.05 | 1,108 | 3.03 | 62 |
| Simply Asset Finance Operations | 240.99 | 1,963 | 4.28 | 106 |
| Skipton Business Finance Ltd | 20.80 | 89 | 0.51 | 8 |
| Social Investment Business Foundation | 13.86 | 77 | 0.61 | 6 |
| Social Investment Scotland | 1.82 | 19 | 0.02 | 1 |
| SWIG Finance | 22.68 | 188 | 1.48 | 24 |
| Time Finance plc | 15.68 | 67 | 0.12 | 4 |
| Tower Leasing Ltd | 21.53 | 222 | 0.73 | 16 |
| TVC Loans NPIF GP Limited | 18.52 | 53 | 0.30 | 2 |
| UK Steel Enterprise Ltd | 1.52 | 8 | 0.33 | 3 |
| Grand Total | 4,297.61 | 24,771 | 103.30 | 1,750 |
Note on Breakdown of facilities drawn and settled table
As part of an acquisition by Nationwide Building Society of Virgin Money UK plc, Nationwide has acquired the Clydesdale Bank plc banking business including its GGS/RLS3 lending. The transfer of scheme loans between Clydesdale and Nationwide took place within the Scheme portal in April 2026 and was first reported in the June 2026 data.
Drawn by Region/Nation
| Region | Drawn value (£m) | Number of facilities | No. of facilities per 10,000 SMEs** |
|---|---|---|---|
| East Midlands | 333.08 | 1,890 | 46.96 |
| East of England | 431.11 | 2,418 | 41.78 |
| London | 760.98 | 3,934 | 37.76 |
| North East | 134.41 | 861 | 51.72 |
| North West | 474.47 | 2,752 | 54.10 |
| Northern Ireland | 58.12 | 288 | 20.77 |
| Scotland | 238.51 | 1,508 | 41.75 |
| South East | 577.93 | 3,449 | 39.36 |
| South West | 355.17 | 2,086 | 37.08 |
| Wales | 150.80 | 988 | 50.90 |
| West Midlands | 415.58 | 2,514 | 55.79 |
| Yorkshire and The Humber | 354.82 | 2,017 | 49.41 |
| Unspecified* | 12.63 | 66 | - |
Notes on Drawn by Region/Nation table
* This includes Channel Islands, Isle of Man and the facilities where location could not be specifically determined through information provided by lenders.
**The data for ‘Number of facilities per 10,000 SMEs’ is a calculation utilising data sourced from Business population estimates 2025 - GOV.UK.
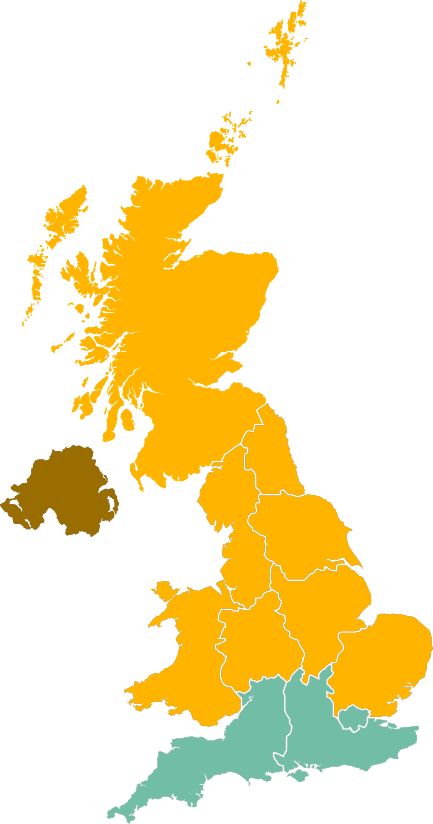
-
<20
-
20-29.9
-
30-39.9
-
40+
Drawn by Sector
| SIC Group | Drawn value (£m) | Number of facilities |
|---|---|---|
| Accommodation and food service activities | 286.46 | 1,700 |
| Activities of extraterritorial organisations and bodies | - | - |
| Activities of households as employers; undifferentiated goods-and services-producing activities of households for own use | 0.25 | 4 |
| Administrative and support service activities | 414.90 | 2,360 |
| Agriculture, forestry and fishing | 89.88 | 778 |
| Arts, entertainment and recreation | 132.99 | 804 |
| Construction | 415.07 | 2,762 |
| Education | 45.96 | 340 |
| Electricity, gas, steam and air conditioning supply | 5.54 | 41 |
| Financial and insurance activities | 193.58 | 551 |
| Human health and social work activities | 164.48 | 965 |
| Information and communication | 205.33 | 1,014 |
| Manufacturing | 672.04 | 3,281 |
| Mining and quarrying | 14.93 | 60 |
| Other service activities | 99.19 | 807 |
| Professional, scientific and technical activities | 350.35 | 1,951 |
| Public administration and defence; compulsory social security | 2.09 | 15 |
| Real estate activities | 267.13 | 936 |
| Transportation and storage | 204.03 | 1,768 |
| Water supply; sewerage, waste management and remediation activities | 74.19 | 355 |
| Wholesale and retail trade; repair of motor vehicles and motorcycles | 659.24 | 4,279 |
| Grand total | 4,297.61 | 24,771 |
Drawn by Scheme Facility Type
| Scheme facility type | Drawn value (£m) | Number of facilities |
|---|---|---|
| Business term loan | 3,169.24 | 17,094 |
| Asset finance | 978.30 | 7,071 |
| Invoice finance | 126.89 | 572 |
| Revolving credit | 23.19 | 34 |
| Grand Total | 4,297.61 | 24,771 |
Drawn by Company Size
| Company size (number of employees) | Drawn value (£m) | Number of facilities |
|---|---|---|
| Fewer than 10 | 1,695.62 | 14,511 |
| Between 10 and 49 | 1,797.09 | 8,187 |
| Between 50 and 249 | 732.64 | 1,940 |
| More than 250 | 72.26 | 133 |
| Grand Total | 4,297.61 | 24,771 |
Drawn by Facility Size
| Facility size (£) | Drawn value (£m) | Number of facilities |
|---|---|---|
| Less than 10K | 0.97 | 162 |
| 10K to 25K | 12.65 | 664 |
| 25,001 to 50K | 200.64 | 5,515 |
| 50,001 to 100K | 515.42 | 6,936 |
| 100,001 to 250K | 1,202.13 | 7,471 |
| 250,001 to 500K | 872.13 | 2,508 |
| 500,001 to 1m | 735.79 | 1,026 |
| 1m to 2m | 757.88 | 489 |
| Grand Total | 4,297.61 | 24,771 |
Drawn by Turnover
| Turnover (£) | Drawn value (£m) | Number of facilities |
|---|---|---|
| Less than 50K | 89.58 | 670 |
| 50,001 to 100K | 126.23 | 1,515 |
| 100,001 to 250K | 272.45 | 3,091 |
| 250,001 to 500K | 368.09 | 3,511 |
| 500,001 to 1m | 571.13 | 4,343 |
| 1m to 5m | 1,531.42 | 8,077 |
| 5m to 25m | 1,155.49 | 3,244 |
| 25m to 54m | 183.22 | 320 |
| Grand Total | 4,297.61 | 24,771 |
Drawn by Age of Business
| Age of business | Drawn value (£m) | Number of facilities |
|---|---|---|
| Less than 1 year | 392.69 | 1,653 |
| 1 to 4 years | 774.39 | 5,285 |
| 5 to 9 years | 997.41 | 6,813 |
| 10 to 14 years | 738.65 | 4,335 |
| 15 to 24 years | 803.86 | 4,145 |
| 25 to 49 years | 471.62 | 2,024 |
| 50 years or more | 118.99 | 516 |
| Grand Total | 4,297.61 | 24,771 |
Suspected fraud
Lenders have currently identified 36 facilities (RLS 3 – 21 & GGS – 15), with an aggregate drawn value of £10.00m as suspected fraud. This equates to 0.15% of the total number of drawn facilities and 0.23% of the total drawn value. Lenders continue to review cases, and consequently this figure is subject to change. This relies on lenders’ business as usual threshold for fraud reporting – that is, the lender has established sufficient grounds to suspect fraud, which is then reported via the British Business Bank portal.
Lenders are not law enforcement agencies or investigatory organisations. Where they have a suspicion that fraud has been committed by a borrower, they will indicate so in the information which they provide to the British Business Bank. Ultimately it is law enforcement/ the courts that determine whether or not a fraud has been committed, and so the statistics presented are only an indicator of the levels of suspected fraud that have been identified within the scheme at a given point in time.
Definitions
- Definition of values:
- The value for ‘Claimed’ is the amount claimed under the guarantee
- The value for ‘Settled’ is the amount paid out under the guarantee
- The value for ‘Fully Repaid’ is the full facility amount
- The value for all other life events is the outstanding balance
- Arrears - facilities with missed repayments are deemed to be in arrears and are tracked in 30, 60 and 90 day cohorts by lenders to manage risk. Lenders report monthly arrears updates through the Scheme portal on a 'best endeavours' basis. Some lenders submit arrears via the automated (API) functionality in the Scheme portal, but it is not always possible for smaller lenders to integrate with this functionality so arrears are sometimes entered manually. Facilities in arrears that have moved to a later life-cycle stage (such as Defaulted) will be reported in the later life-cycle stage but may still carry arrears. At the time of this event occurring, this is an actual balance, and not estimated.
- Claimed - the Lender has submitted a claim under the guarantee. Facilities sit in the claimed status while the British Business Bank awaits/processes the invoice for the claim and runs relevant checks. Under the terms of the guarantee the claim must be paid within 30 days of receipt of the claims invoice.
- Defaulted - facilities where the lender has issued a formal demand to the borrower. At the time of this event occurring, this is an actual balance, and not estimated.
- Drawn value - the total amount for facilities which have been drawn down by the borrower.
- Facility or facilities - refers to a Recovery Loan Scheme (third iteration)/Growth Guarantee Scheme facility or facilities, being either a term loan facility, a revolving credit facility, an invoice finance facility or an asset finance facility (as applicable) made available by an accredited lender to a borrower.
- Fully repaid - the facility is considered closed because there is no outstanding balance guaranteed, this may be due to the scheme facility being fully repaid or due to the lender disclaiming the guarantee.
- On schedule - the facility is being repaid as expected, including facilities for which repayment is not yet due.
- Outstanding balance - when used to describe facilities on schedule, this is the remaining principal balance of the facilities. This figure is provided by lenders on a monthly basis until a facility defaults or is fully repaid.
- Scheme portal - the database hosted by the Bank as part of its role in administering the schemes. It is used by all accredited scheme lenders to report on guaranteed facilities and make claims under the guarantee agreement. The reporting requirements have evolved over time. The portal is updated at various points in a facility lifecycle as reported by lenders.
- Settled - settlement has been made following a lender making a claim. Once the guarantee claim is processed and payment is released, the facility is marked as settled on the Scheme portal.
- Turnover - estimated annual turnover of the borrower, inputted by the lender.
Limitations and further considerations
The following should be considered in relation to the data:
- Data is as at 30 September 2026, and extracted on the 15 October 2026, from the information continuously submitted to the British Business Bank’s portal by accredited lenders. The portal is used by the British Business Bank and lenders to administer the facilities. Portal data is dependent on lenders submitting accurate and timely data and is not real-time.
- The terms of and the timing of the scheme may not be representative of the lenders’ risk appetites, their general loan credit quality, or their default experience.
- Given the size of the scheme, the numbers of facilities, and the period over which they are being offered and drawn down, data being collected remains fluid and subject to refinement and correction over time (comparative analysis may therefore have limitations).
- The timing and level of claims made on the guarantee will vary according to a lender’s business model and the characteristics of their customers (for example repayment options offered, age of businesses, whether new or existing customers).
- Some lenders may be more advanced than others in operationalising their Claims and Recoveries processes which could lead to figures being distorted initially but this will stabilise over time.
- Lenders may submit guarantee claims monthly or quarterly in line with the terms of the guarantee.
- Claims on the guarantee may subsequently benefit from recovery receipts achieved at a later date (which are not reflected in the figures above), and so are not a conclusive indicator of net cost to government.
- All data excludes loans where a scheme guarantee has been removed and the facility is no longer covered by the scheme.
This data is not suitable to be relied on by any party wishing to acquire rights against the British Business Bank group of companies (“BBB”) or any of the Growth Guarantee Scheme/ Recovery Loan Scheme (third iteration) guarantee scheme lenders for any purpose or in any context. Any party choosing to rely on the data detailed in this release (or any part of it) does so at its own risk. To the fullest extent permitted by law, the British Business Bank does not assume any responsibility or liability to any other party in respect of this data.
Notes
The third iteration of the Recovery Loan Scheme no longer accepted applications after 30 June 2024. As stated above, it was announced in the 2024 Spring Budget that the scheme would be renamed the Growth Guarantee Scheme (GGS) and extended for a further two years until 31 March 2026. In the 2025 Spending Review the Growth Guarantee Scheme (GGS) was further extended until 31 March 2030. GGS is open to new applications through participating lenders, who are listed on the British Business Bank website.
GGS is designed to support access to finance for UK smaller businesses as they look to invest and grow.
Further information, for businesses and lenders, is available on the British Business Bank website.